Dividend Calculator – Calculate Your Dividend Income
Starting Value
Monthly Contributions
Number of Years
Annual Dividend Yield
Dividend Growth Rate
Annual Share Price Growth
How to Use the TrackYourDividends’
Dividend Calculator
There are many benefits to dividend investing calculator. The income a dividend portfolio produces can offer a steady payment, provide a hedge against rising inflation, and give you compounding benefits over time. It shouldn’t be a surprise that interest in dividend investing has been on the rise.
Another appeal of dividend investing calculator is that it can be less time-consuming and stressful than falling into the trap of day trading and constantly monitoring the ups and downs of stock prices. However, you will be well-served by evaluating your yield and the potential growth of your investments.
You Move What You Measure
If your goal is to increase your dividend income over time, you must use a dividend investment calculator. You can only move what you measure. A dividend income calculator not only allows you to see where you are, but also it allows you to gauge what changes you may need to make to maximize your future results.
TrackYourDividends’ Dividend Calculator is a simple, yet powerful tool that enables you to calculate the compounded dividend returns of your portfolio as well as individual stocks. Even better, it is free to use.
Analyzing the Results
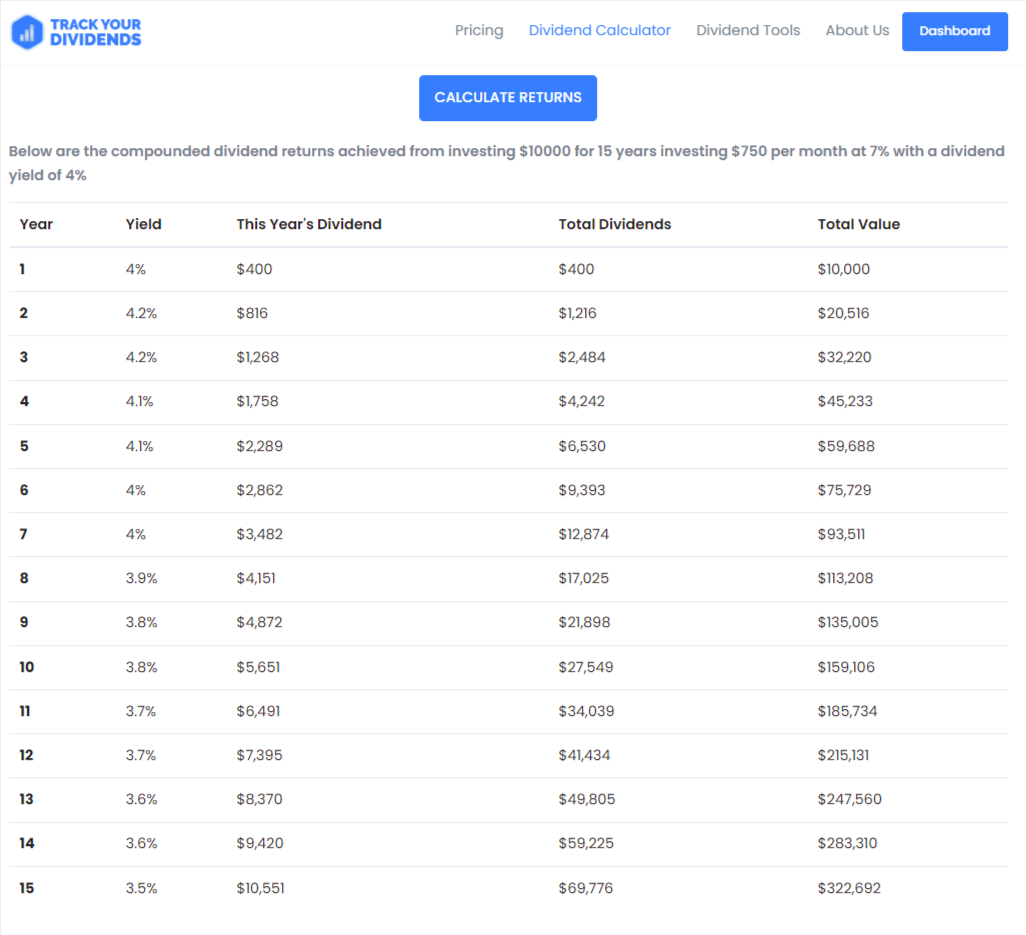
After you enter data into all seven fields, you can use the Dividend Calculator to calculate your dividend returns.
Year is straight forward; it is the number of years you have been invested.
The Yield column shows you the initial Annual Dividend Yield multiplied by the Dividend Growth Rate. As you can see, each year your yield will increase.
This Year’s Dividend, which shows you’re your annual dividend payment, it will also increase as you reinvest.
The Total Dividends column is a running total of your dividend payments.
The Total Value column allows you to see the impact your dividends have on your Starting Principal year after year.

Using TrackYourDividends’ Dividend Calculator
Let’s look at how to use our simple Dividend Calculator or Dividend Investment Calculator. You will begin by entering data into seven fields: Starting Principal, Monthly Contribution, Annual Dividend Yield, Dividend Growth Rate, Annual Share Price Growth, Number of Years, and Maximum Dividend Yield.
In the Starting Principal field, you will add the dollar amount you originally invested. This can be how much you invested in either your entire dividend portfolio or an individual security.
For Monthly Contributions, you will enter the amount that you plan to add to your dividend investment each month. Making regular contributions to your account is one of the best ways to increase your income and receive compounding benefit over time.
Annual Dividend Yield is a measure of the annual percentage paid by the security. Keep in mind, it is unrealistic to expect payments exceeding 10 percent over the long term. Currently, the dividend yield on the S&P 500 is approximately 1.5 percent.

You will find your portfolio yield in the TrackYourDividends Dashboard.
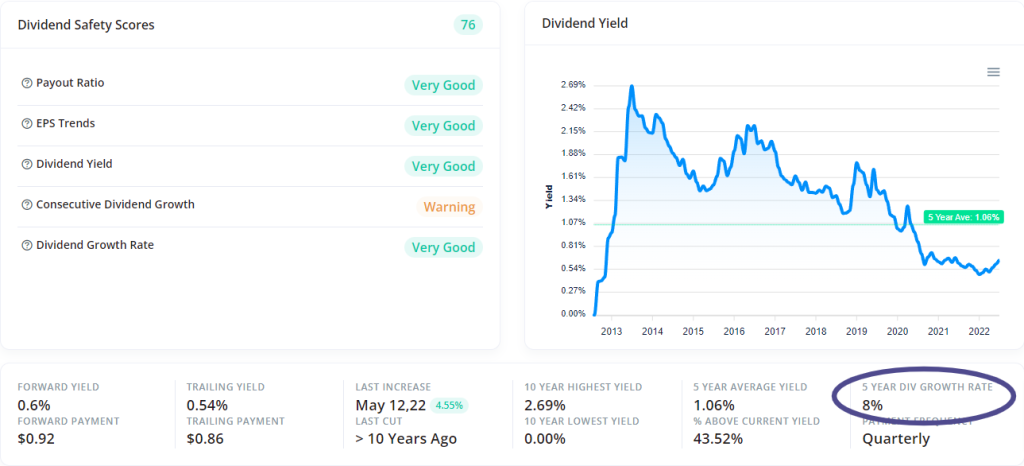
Dividend Growth Rate is the percentage increase of the dividend payment during a certain period of time. It allows you to evaluate a company’s long-term profitability. It is calculated year by year, but the five-year growth rate shows a better long-term picture. A growing dividend payment helps keep up with inflation. It is also a good indication of a company’s commitment to paying dividends. You can find the Dividend Growth Rate for each of your holdings in the TrackYourDividends Dashboard of the dividend growth calculator.
Simply click on the ticker symbol of the holding.

When you are using TrackYourDividends Dividend Calculator for your entire portfolio, you can estimate the dividend growth rate. An estimate of three to five percent is a good starting point.
In the Annual Share Price Growth Rate field, you will enter the estimated increase in the price of your shares. It is reasonable to expect between six and eight percent. Keep in mind the total Share Price Growth and Dividend Yield should not exceed 12 to 15 percent.
In the Number of Years, you will type in how many years will plan to be invested in your dividend portfolio. Of course, longer is better when it comes to the growth of your portfolio. But, it is also important to keep in mind, longer projections become more inaccurate.
Maximum Dividend Yield is simply the maximum percentage of yield you anticipate your portfolio or an individual holding to produce. Eight percent is a reasonable estimate for this field.
Modeling Outcomes
By tweaking the information that you enter in the Dividend Calculator, you can model and project different scenarios. For example, increasing the Annual Dividend Yield by even one percent will have a significant impact on your overall returns. An increase in the Dividend Growth Rate will also positively affect your income.
However, the role share price plays on your overall return is a little more complicated. Your overall profits come from a combination of dividend payments and gains in the stock’s price. Each component is calculated separately in our dividend calculator. In other words, an increase in the stock’s price will not move the yield higher. In fact, the yield will actually decline if the dividend payment does not also increase.
Modeling results beyond 10 years can create some fantastic, but unrealistic results. It is very difficult for companies to maintain consistent dividend payment increases and price appreciation for long periods of time. Accurate, conservative inputs into the dividend calculator should produce the most accurate estimates.
By using our simple dividend calculator to calculate dividend payouts, you will be able to more clearly see how small changes can have a direct impact on your return and growth over time.
Dividend Calculator by Stock
TrackYourDividends tool can be used as a stock dividend calculator or as a dividend growth rate calculator. When you are looking at individual stocks, you can easily find accurate data for each field to get a big-picture look at the impact an individual holding will have on your portfolio. Not only will you be able to quickly get an in-depth analysis of your current holdings, but the stock dividend calculator also offers you another way to analyze and identify which stocks have the best ability to help you meet your long term investing objectives. Our dividend calculator works with stocks or ETFs and gives you the best results using yield, price, and dividend growth.
Dividend Portfolio Calculator
The Dividend Portfolio Calculator is also an excellent tool to help you evaluate your entire dividend portfolio. You will be able to measure yield, growth and the effects of compounding. Although you may not know the exact numbers to enter into each field, educated estimates will provide a pretty accurate estimate.
Future Value Calculator
Another incredibly useful feature in the TrackYourDividends Dashboard is the Future Value Calculator. You will find a link to it in the top navigation bar of your Dashboard.
Similar to the Dividend Calculator, this Future Value Calculator allows you to customize and adjust figures to model and project different future outcomes. It displays your data in a table, which provides you with a fantastic visual of the impact dividends can have on your portfolio over time.
When it comes to dividend investing, it may be tempting to take a hands-off approach. However, by carefully analyzing each of your holdings, as well as the overall yield and return of your dividend portfolio, you will have a better understanding of what your investments are doing for you. TrackYourDividends Dividend Calculator is certainly an effective tool to help you meet your objectives.
See The Importance of Dividends
In periods of slow growth, a majority of your portfolio’s return can come from dividends. Reinvesting these dividends will add to the compound growth over the long term. Keep in mind, the projected value is only as good as the input values. Use realistic assumptions and expectations to see the most accurate projections.
Compound interest is a phenomenon that dictates how your portfolio will grow in the future if you reinvest your current profits. This aspect of investing is amplified when dealing with dividend stocks since you are actually paid cash. Consistent reinvest amplifies future payments.
The awesome thing about compound interest is that if you continue to reinvest your profits year after year – your annual dividend income will actually increase exponentially. This means that your income will grow faster in the future. Compound dividend growth and reinvestment will allow you to reach your goals sooner. Start using the dividend reinvestment calculator or compound dividend calculator to get the benefits in income growth.
What is the goal of every dividend investor?
Steady, Reliable, Predictable, and Rising Income


