

Historical data is essential for investors to make informed decisions – and historical dividend data is no exception. But unfortunately, while many popular financial websites provide the raw data, only a handful convert that data into actionable insights. And fewer deliver additional metrics and insights you need to be a successful dividend investor.
In this article, we’ll take a closer look at dividend investing, how historical data plays a role, and some other tips to remember.
Dividend investors rely on all kinds of information to make informed decisions, including historical dividend data. Fortunately, there are several places to find actionable information to make data-driven decisions. Click To Tweet
Dividend Investing 101
Many investors seek to generate income rather than growth (capital gains) with their portfolios. For example, retirees typically invest in fixed-income or other income-generating securities to cover their living costs. While bonds are the most popular income investments, dividend stocks offer an attractive combination of income and capital gains potential.
Dividends enable investors to generate income without selling stocks and realizing capital gains. Moreover, qualified dividends have a maximum tax rate of just 20%, significantly less than the ordinary income tax rate affecting most interest income. As a result, it’s a tax-efficient way to generate investment income for any reason.
Many dividend-paying stocks are also blue-chip companies with stable earnings and long-term growth potential. For example, the so-called Dividend Aristocrats (companies paying dividends the longest) include well-known names Coca-Cola (KO) and Procter & Gamble Inc. (PG), which have annualized returns of 8.18% and 9.24%, respectively.
Why Does Historical Data Matter?
Investors rely on all kinds of historical data to make critical decisions. For instance, technical analyses rely on historical prices, and you need past financial statements to compute financial ratios. Similarly, historical dividend data can be helpful when assessing a dividend-paying company’s track record or long-term trends.
The most important pieces of data include:
- Track Record – The Dividend Aristocrats and other companies have been paying dividends for decades. As a result, income investors can be reasonably confident these payments will continue in the future, barring some extreme market events.
- Dividend Increases – Many income investors seek out dividend-paying companies with a track record of increasing their payments. After all, these increases help increase income and signal a company’s dedication to its shareholders.
- Dividend Cuts – Dividend cuts can occur for various reasons, but it’s helpful to know whether it’s going to be a common occurrence or something that only happens during a crisis.
When looking at these trends, it’s helpful to quantify trends to spot patterns. For example, you might calculate the number of quarters of consecutive dividend increases to compare opportunities. Or you may look at the average dividend increase over a five- or ten-year period to find companies with the fastest-growing dividends.
Where to Find Historical Data
Most popular financial websites provide access to a stock’s dividend history. For example, TrackYourDividends Dividend History section lists a company’s past dividends by date, including columns for the ex-dividend date, type (cash or stock), amount, declaration date, record date, and payment date. You can also see details about the current dividend.
Other sources of historical dividend data include:
- Investor Relations – Many public companies have investor relations websites that provide past dividend data in tabular form. However, that’s not the case for every company and each company may have its own data formatting.
- Brokerage Accounts – Some brokers provide historical dividend data to their customers on company detail pages. Generally, the data comes in tabular form and may or may not be exportable for further analysis.
- Stock Exchanges – Stock exchanges (like Nasdaq mentioned earlier) may provide historical dividend data. But, you may need to browse multiple websites to get the information if you trade stocks across exchanges.
Ultimately, most historical dividend data is a giant list of numerical values, providing little insight without crunching numbers. While some investors are comfortable inside Excel, others may prefer to use purpose-built tools that automatically compute these figures and deliver actionable intelligence you can use on the spot.
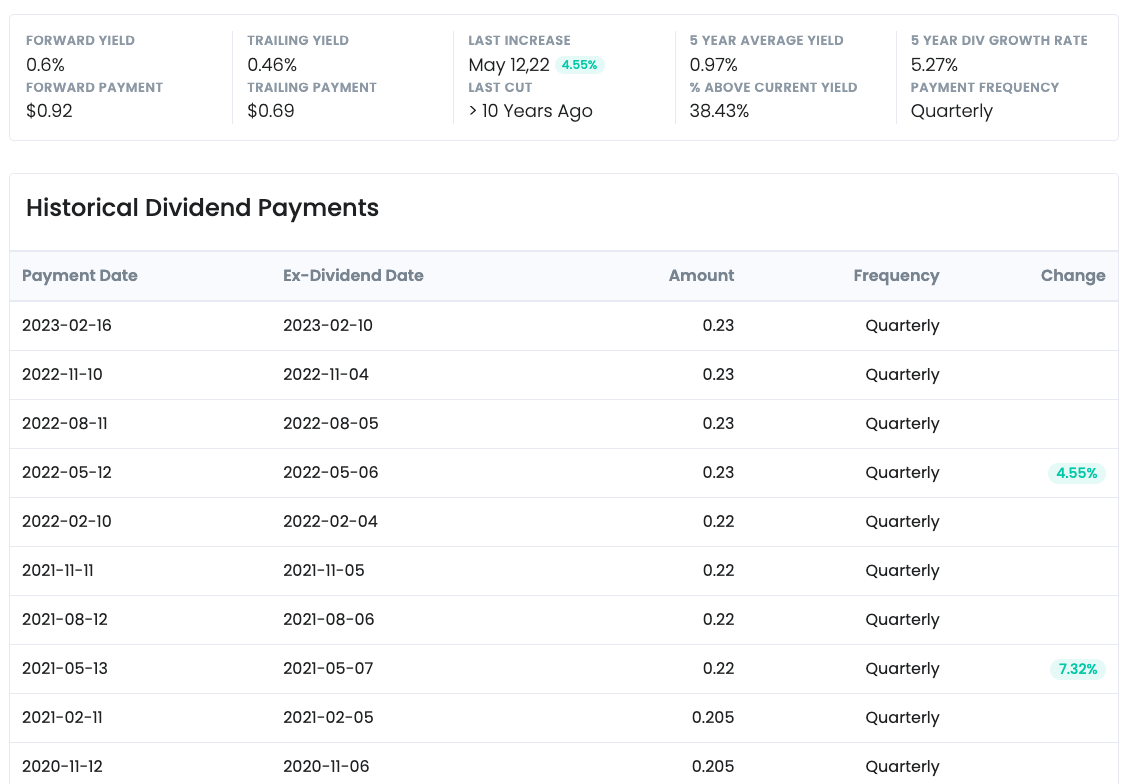
TrackYourDividends makes it easy to access must-have information to assess dividends, including payout ratios, growth rates, and much more. Source: TrackYourDividends.com
TrackYourDividends.com goes further by analyzing historical dividend data to produce actionable insights. For instance, you can instantly see average yields over time, years of dividend increases, and even competitor analysis to see how a company’s dividend compares to its industry peers and other potential opportunities.
Access a full list of companies and their dividend history for free.
Looking Beyond Historical Data
Historical data helps assess a company’s payment history and any increase or decrease in dividends – but it’s not the only metric you should use to make investment decisions.
Several other metrics can help you measure dividend sustainability and determine if the underlying company is at risk of cutting its dividend over time.
Some other metrics to watch include:
- Dividend Payout Ratio – The dividend payout ratio is the percentage of a company’s earnings that it pays out as dividends. It’s an excellent way to assess a dividend’s sustainability.
- Earnings Growth Rate – Without earnings growth, it’s challenging to pay progressively higher dividends. Past performance doesn’t guarantee future results, but it’s usually better to see past earnings growth than earnings decline.
- Debt-to-Equity Ratio – A company’s debt-to-equity ratio compares its total debt to total equity to illustrate its leverage. Of course, highly-indebted companies may have interest expenses that eat into cash flow and put dividends at risk.
TrackYourDividends.com provides a wealth of information for dividend-focused investors. In addition to historical data, the platform provides instant access to highly-relevant payout and valuation ratios. Meanwhile, the dividend screener makes it easy to develop a short list of opportunities without manually pouring over data points.
The Bottom Line
Many income investors use dividend stocks to generate tax-efficient income while capitalizing on the upside potential of equities. While historical data plays an essential role when analyzing dividend stocks, these aren’t the only metrics you should use to make decisions. It’s equally important to look at dividend payout ratios and other measures.
If you’re just getting started with dividend investing, TrackYourDividends.com provides a comprehensive course to help you get started on the right foot. We cover everything from the most important dividend calculations to Dividend ReInvestment Plans (DRIPs) to the ins and outs of building a portfolio.
Sign up for a free trial and get the course free!
If you already invest in dividend stocks, TrackYourDividends.com can help you find the best opportunities and track your portfolio over time. After connecting your account, you can receive alerts for your dividend events, project your income, and make data-driven decisions.


